Recent searches
Search options
In today's edition of "more fun ways to examine the stock market", everyone is asking if we've found a bottom yet. I have no idea, but we can look at some trends to give us an idea on probabilities.
Before some *nerdy* charts, let's explain moving averages.
This chart has two moving averages in the middle pane. Blue line is 50 day moving average and red is the 200 day moving average. These lines smooth out price action and highlight trends.
We can aggregate some data across indexes and examine moving averages on lots of stocks. This chart looks busy, but it measures the percentage of stocks where price is above its 20 day moving average.
A high percentage is bullish (shows market strength), but too high can mean that the market has gone into a state of euphoria. Low percentages mean exactly the opposite.
We're seeing higher lows recently like we saw in Oct/Nov 2023.
It's important to note that 20 day MA lines are short term measurements. We can adjust the chart to examine 200 day MA lines for a longer term look.
This shows that the longer term picture is very different than the Oct/Nov 2023 bull market start. Note that the lines did not dip as low recently (except the NASDAQ).
Then I start to wonder... What's up with the NASDAQ?
If we chart NASDAQ versus the S&P 500 head to head, NASDAQ made new highs in 2024, but it was done with less momentum than in 2021. NASDAQ is full of technology stocks and these are already heavily concentrated in the S&P 500.
If tech stocks are going to lag the market, then the market is likely going to be under pressure for a while. Yes, the NASDAQ does have more violent swings than the S&P 500, but this comparison highlights a problem.
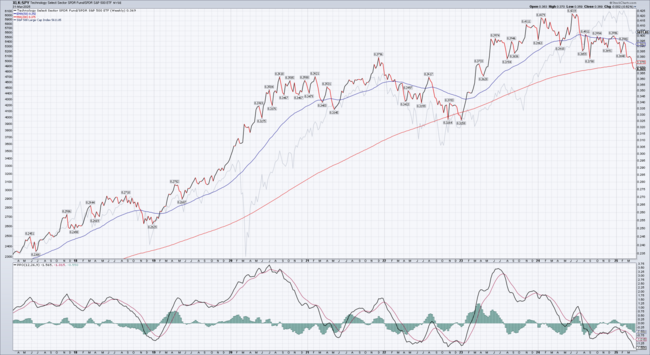
We can also examine tech stocks using XLK, the S&P 500 technology ETF. If we plot its price against SPY, the overall S&P 500 ETF, we end up with this chart.
I see new highs in 2024 that didn't have enough momentum against the broader market. As the tech names weakened, their massive concentration in big ETFs brought those ETF prices down faster.
Is the bottom in? I'm not sure.
The one thing I can say with certainty is that predicting the future is extremely difficult and very tiring. I try to avoid it.
I look at it as risk versus reward. It's difficult for me to pinpoint a trend anywhere. That means the risk to reward ratio is too high (risk outweighs reward).
I'll just sit here with my US treasury bills (SGOV ETF) and wait for the trend to change.
Not financial advice. Please do your homework.
These stock market-related threads are:
(feedback welcomed!)
@major not particularly useful for me, but I will take anything that brings a conversation that goes beyond the usual "two-minutes rage" that is prevalent here.
@raphael Hah, that's good feedback. I enjoy sharing knowledge with others and this is an area where I've tried to teach myself a lot lately.


